Podcars will come to terms with public transit – unaffordable in emerging economies and heavily subsidized in market economies. Examples from the USA demonstrate the technological inadequacy of current public transit modes.
| Mode | Cost/mile | Cost/km |
| Heavy Rail | $262 million | $162 million |
| High Capacity Rail | $256 million | $159 million |
| Light Rail | $171 million | $106 million |
| Streetcar | $38 million | $24 million |
| Commuter Rail | $36 million | $22 million |
| Bus Rapid Transit | $9 million | $6 million |
| Average All Modes | $89 million | $55 million |
| Public Transportation Investment History • Background Data • Table 23 APTA 2015 | ||
Capacity
Superficially it would appear that public transit has high capacity.
Light Rail can hold 255 people in each vehicle, which in turn can be linked into a train of two or more cars. Light Rail is smaller and slower than High Capacity Rail, but travels faster and carries more passengers than streetcars or buses. High Capacity Rail is larger and longer, holding up to 1500 passengers (in ‘crush’ conditions).These numbers seem compelling but such High Capacity Trains require long headways, with extensive empty sections of track between trains, equivalent to trying to make a bucket brigade more effective by using larger buckets. In reality a fire hose carries more water by streaming it.
High Capacity Rail gets power from an electrified rail below the train and requires large stations, more infrastructure and safety separation. Light Rail can run above ground at street level, like streetcars, however it operates in separated lanes, meaning it is not affected by car and truck traffic. Stops are planned to be about 500 metres apart, but closer than High Capacity Rail stops. For more details, please refer to Passenger rail terminology in Wikipedia.
High capacity rail systems require stations too large to fit above ground in dense urban areas or to be affordable in suburban settings, and trains usually stop at all stations en route.
| Relative Capacity per Hour (not all seats are filled) | |||
| Mode | Seats per Vehicle | Headway | Seats per Hour |
| Bus | 0-50, 50 used | 5 mins | 600 |
| Light Rail | 0-200, 200 used | 10 mins | 1,200 |
| Automobiles | 1-6, 4 used | (3 legal) 1-6 secs | 4,800 |
| Podcars | 1-8, 4 used | 3 secs | 4,800 |
| Podcars | 1-8, 4 used | 1 secs | 14,400 |
| Podcars | 1-8, 4 used | 0.5 secs | 28,800 |
| Podcars | 1-8, 4 used | 0.25 secs | 57,600 |
| * 0.25 second headway gives each vehicle 3.91 meters of space | |||
| Adapted from JPods 2018 | |||
The capacity of the vehicle is not the throughput of the network.
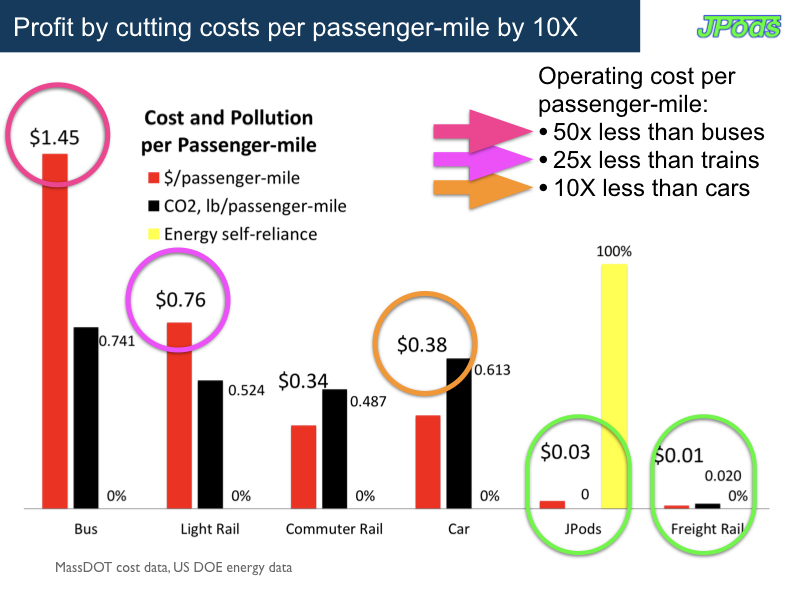
Operating Costs
When these high capital costs are amortized over time to be repaid at the farebox, deficiencies are deflected into subsidies. Public transit systems are heavily subsidized throughout the world, with some notable exceptions in east Asia and London. (Curiously, the farebox recovery rate in Silicon Valley is one of the poorest, on the order of 10%, where it costs more to accommodate a public transit commuter than it costs to own and operate a car.)
 |
| (Source: Wikipedia) |
Another important cost metric is safety.
| 2016 motor vehicle crash highlights | |
| Deaths | 40,327 |
| Medically consulted injuries | 4.6 million |
| Cost | 416.2 billion |
| Motor vehicle mileage | 3.174 billion |
| Registered vehicles in the United States | 269 million |
| Licensed drivers in the United States | 222 million |
| Death rate per 100 million vehicle miles | 1.3 |
| Death rate per 10,000 registered vehicles | 1.5 |
| Death rate per 100,000 population | 12.5 |
Injury Facts, National Safety Council
By removing sovereign immunity, government officials would be personally accountable, operating as commercial mobility networks. Radically safer transportation networks would replace the unsafe, internally regulated government monopolies.
More
Future posts will delve into these factors in greater detail.


